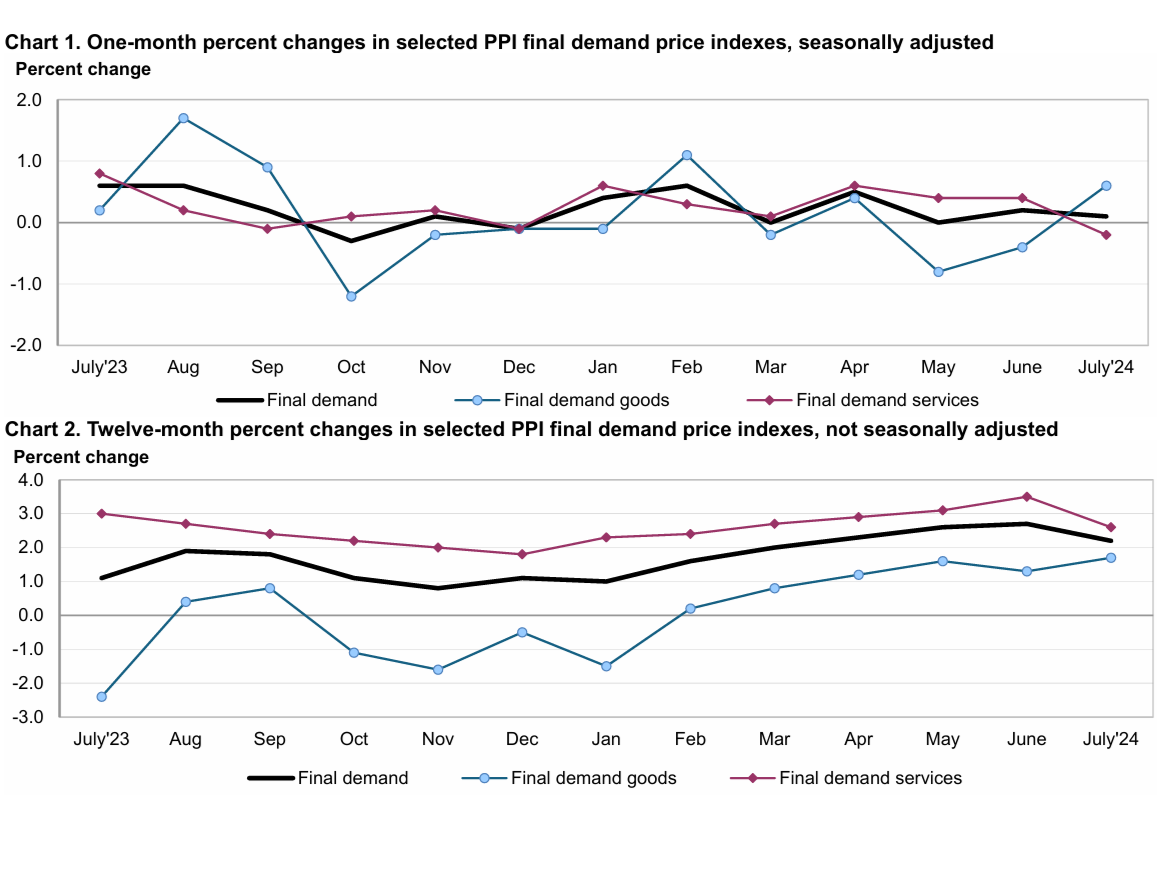
The Producer Price Index (PPI), which reflects what suppliers charge businesses and other customers and is generally considered the core metric of input price changes, rose 0.1 percent in July and 2.2 percent over the past twelve months.
The July rise in the index for final demand can be attributed to prices for final demand goods, which moved up 0.6 percent. In contrast, the index for final demand services fell 0.2 percent.
Prices for final demand-less-foods, energy, and trade services advanced 0.3 percent in July. For the prior twelve months, the index for final demand less foods, energy, and trade services moved up 3.3 percent.
The Producer Price Index includes data on final demand and intermediate demand. Final-demand buyers include consumers, government, and foreigners, as well as domestic industries that purchase the commodity as capital investment. Intermediate demand buyers consist of domestic industries that purchase the commodity as an input to production, excluding capital investment.
The index also breaks down specific commodity categories (i.e., unprocessed foodstuffs and feedstuffs, processed fuels for manufacturing industries, supplies to non-manufacturing industries/feeds, etc.) for final demand buyers as well as intermediate demand buyers.
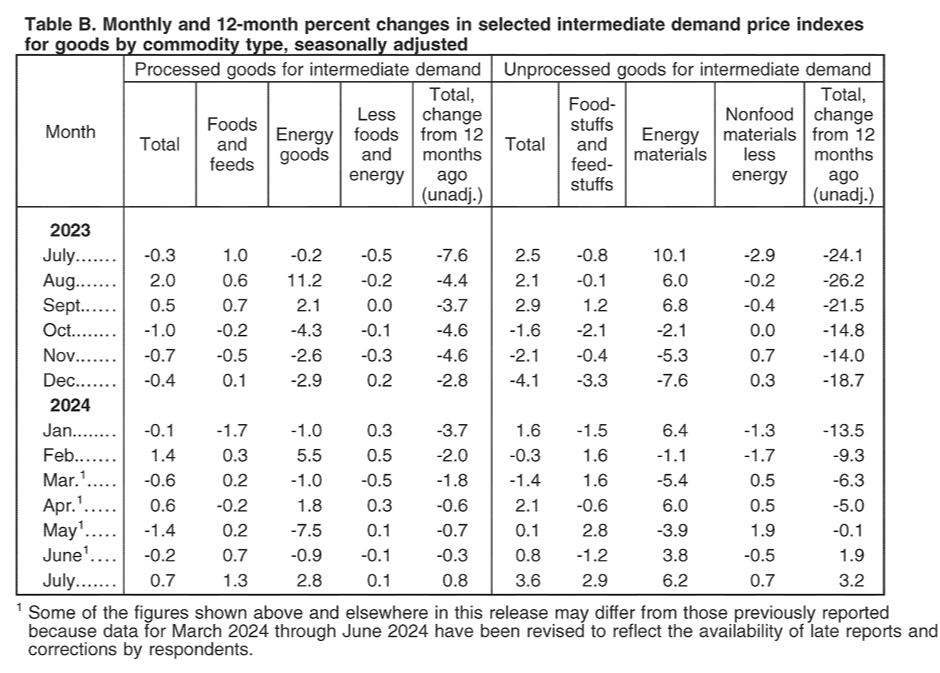
The index for processed goods for intermediate demand rose 0.7 percent in July. The indexes for processed foods and feeds and for processed materials less foods and energy advanced by 1.3 percent and 0.1 percent, respectively. For the 12 months ended in July, prices for processed goods for intermediate demand moved up 0.8 percent, the first increase since a 2.1-percent rise for the 12 months ended February 2023.
The index for unprocessed goods for intermediate demand moved up 3.6 percent in July. The indexes for unprocessed foodstuffs and feedstuffs and for unprocessed nonfood materials less energy advanced 2.9 percent and 0.7 percent, respectively. For the 12 months ended in July, prices for unprocessed goods for intermediate demand moved up 3.2 percent, the largest increase since rising 10.7 percent for the 12 months ended December 2022.
Further information on intermediate demand price changes for processed and unprocessed goods can be found in the chart below, per DOL:

Prices for final demand services fell 0.2 percent in July. The July decline can be traced to the index for final demand trade services, which dropped 1.3 percent. In contrast, prices for final demand services less trade, transportation, and warehousing and for final demand transportation and warehousing services rose 0.3 percent and 0.4 percent, respectively.
Further detail on final demand price changes can be found in the chart below:

The breakdown in final demand for goods versus services can be found in the graphic below.

The full August 2024 Producer Price Index can be found here.

