WHAT HAPPENED: USDA’s Agricultural Marketing Service (AMS) on Monday officially announced in the Federal Register an 18-month delay of the “Poultry Grower Payment Systems and Capital Improvement Systems” rule, which was set to go into effect on July 1, 2026. AMS proposed the delay in March after reviewing the rule’s potential costs to the poultry industry and consumers.
WHY IT MATTERS: The rule would have effectively banned performance-based bonuses for chicken farmers, requiring all growers to be paid the same rate regardless of their hard work, investments, housing conditions, or bird welfare practices. AMS acknowledged that even a small drop in production efficiency under the rule could result in significantly higher broiler costs — ultimately hitting consumers at the grocery store.
NCC’s TAKE: We strongly support the delay. “I want to thank Secretary Rollins for delaying this Biden-era regulation, which was published less than one week before President Trump was inaugurated,” said NCC President Harrison Kircher. “This rule threatened to dismantle an efficient and successful industry model that rewards farmers and helps keep chicken affordable for American consumers. We applaud the Trump administration’s decision to delay this rule and urge its full recission.” Our March press release supporting AMS’s announcement can be found here.
The National Chicken Council’s 2026 Summer Board of Directors Meeting will take place June 11–13 in Jackson Hole, Wyoming.
The meeting will bring together NCC Board members, Allied Leader representatives, and invited guests.
We look forward to welcoming attendees next week and would like to thank our sponsors for their generous support of this meeting.


| 
| 
| 
|

| 
| 
| 
|
| 
| 
| 
|

| 
| 
| 
|
| 
| 
| 
|
WHAT HAPPENED: The House of Representatives yesterday — by a vote of 213-210 — passed its version of the Agriculture, Rural Development, FDA, and Related Agency Appropriations Act of 2027. The bill funds agricultural and food programs and services, including food and medical product safety, animal and plant health programs, rural development and farm services, marketplace oversight and nutrition programs. A summary of the bill is available here.
WHY IT MATTERS: The bill passed with two provisions included that are supported by NCC and important to the broiler industry. The first would rescind several Biden-era Packers and Stockyards regulations, including: the final rule entitled “Transparency in Poultry Grower Contracting and Tournaments;” the final rule entitled “Inclusive Competition and Market Integrity Under the Packers and Stockyards Act;” the final rule entitled “Poultry Grower Payment Systems and Capital Improvement Systems;” and the proposed rule entitled “Fair and Competitive Livestock and Poultry Markets.”
A separate provision would allow surplus broiler hatching eggs to be sold into the breaker market, similar to NCC’s past petitions and bills introduced in Congress.
NCC’s TAKE: NCC advocated for the inclusion of these two provisions, urged final passage of the bill, and we are pleased it contains support for a number of chicken producers’ priorities. “I want to thank Chairmen Cole and Harris for their leadership and for getting this bill over the finish line in the House,” said NCC President Harrison Kircher.
WHAT ELSE IS IN THE BILL: $1.226 billion for the Food Safety and Inspection Service (FSIS), which is $10.8 million above the FY26 enacted level, to fund meat and poultry inspectors.
WHAT’s NEXT: The Senate will take up its version of the spending bill, but the timeframe is unknown.
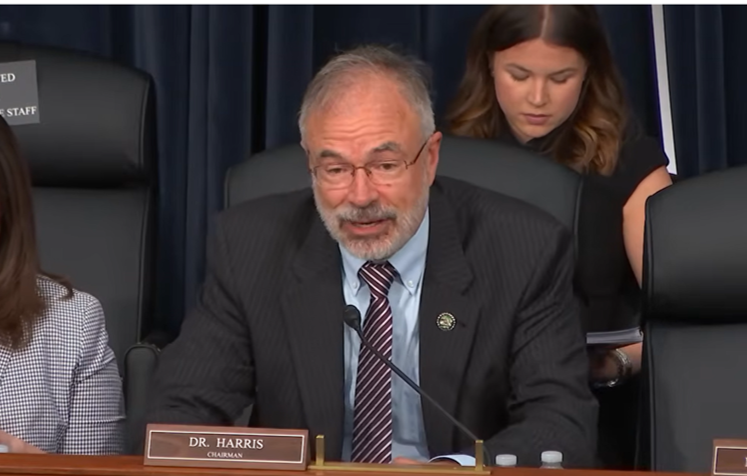
Subcommittee Chairman Andy Harris (R-MD) speaks the committee mark-up of the bill
WHAT HAPPENED: USDA Secretary Brooke Rollins made her second annual appearance before the House Agriculture Committee yesterday in a hearing that touched on a wide-ranging list of topics, from the recent finding of New World Screwworm in Texas to SNAP funding and work-requirement changes to USDA’s reorganization plan.
WHY IT MATTERS: One of the hearing’s recurring themes was the recent House-passed Farm, Food, and National Security Act, also known as the Farm Bill. This bill includes an amendment to add hot rotisserie chicken to SNAP eligibility, which is one of NCC’s priorities.
SNAP CHANGES: The most contentious parts of the hearing were in discussions over SNAP changes made by the “One Big Beautiful Bill” last summer. Numerous Democratic committee members addressed the falling participation in the program and the work requirements enacted in the OBBB as effectively cutting the program. Rollins defended the changes, noting that the roughly 4.5 million fewer participants in the program as a result of work requirements is restoring program integrity.
USDA REORGANIZATION: Rollins also defended USDA’s ongoing restructuring, which impacts many areas of the department and would move staff away from the Washington, D.C. region.
NEW WORLD SCREWWORM: Rollins addressed the recently confirmed detection of NWS, the first U.S. detection since the 1960’s, and sought to reassure members of the committee of USDA’s response to the detection. She noted that USDA has been working with other government agencies and preparing for a potential detection for over a year, including standing up the sterile-fly facility in South Texas and the suspension of live animal imports from Mexico.
WHAT’S NEXT: Secretary Rollins will testify before the Senate Agriculture Committee on Wednesday, June 10, at 10 am EST. A link to the livestream of that hearing can be found here.
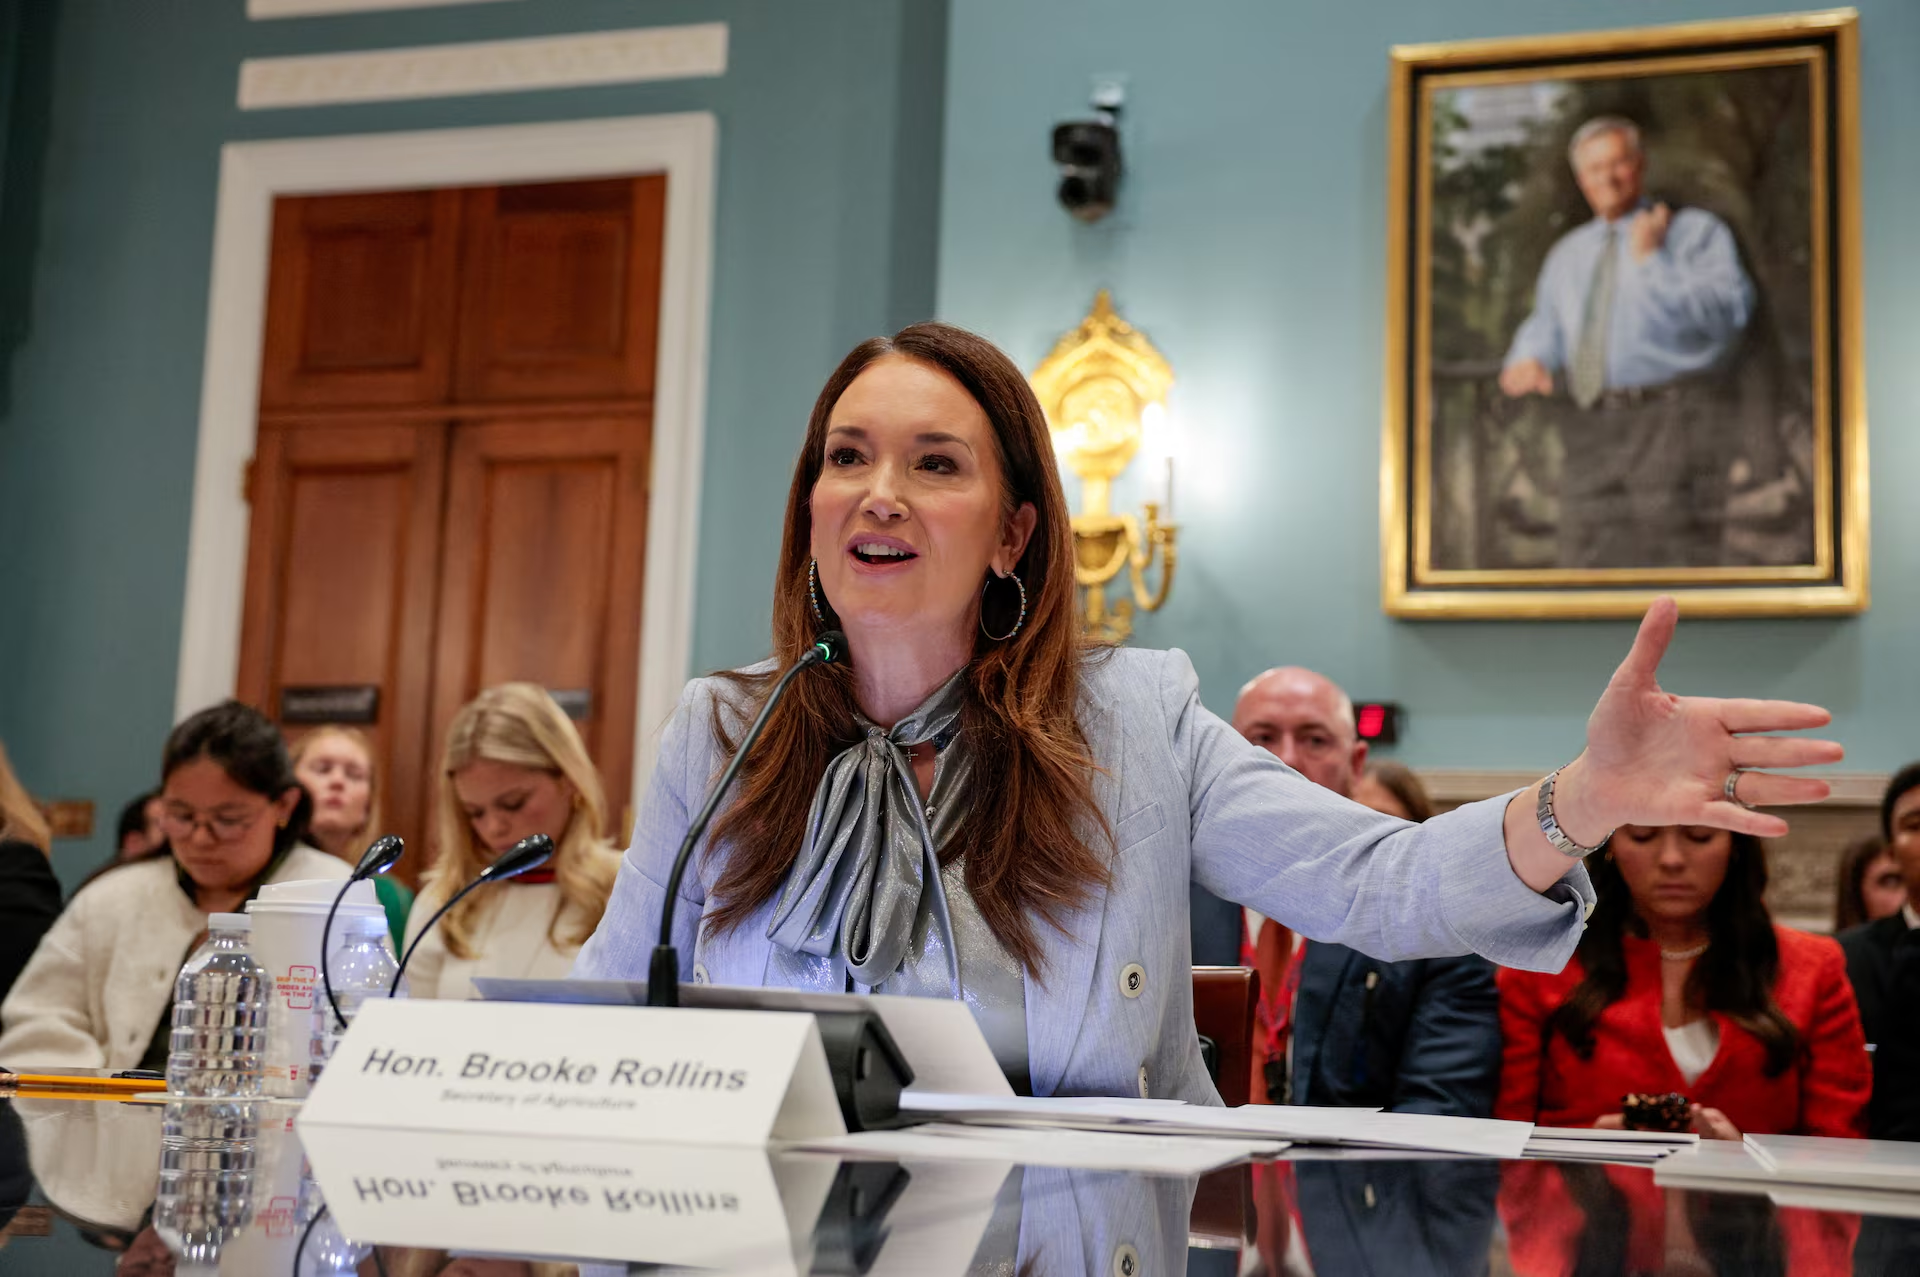
Secretary Rollins testifies at the hearing on Thursday. Source: Reuters
WHAT HAPPENED: Rabobank’s RaboResearch division published a new report, “Protein Economics: How Nutrient Density Can Support Premium Packaged Goods in the US,” examining the growing role of nutrient density in consumer purchasing decisions and how food manufacturers are responding. The report identifies protein as the “winning nutrient” in today’s packaged food landscape and introduces the concept of “protein economics” — evaluating food purchases based on protein delivered per calorie and per dollar spent.
WHY IT MATTERS FOR CHICKEN: Chicken is one of the best values in the entire grocery store when evaluated through the lens of protein economics — and this report makes that case in economic and not nutritional terms. The report finds that consumers are increasingly asking not “how many calories is this?” but “what do I get for those calories?” and “what am I actually paying per gram of protein?” By that measure, chicken wins handily.
THE BIGGER PICTURE: Several structural forces are converging to make this moment particularly important for the chicken industry. The report points to the rapid adoption of GLP-1 weight-loss medications, which reduce appetite and increase consumer focus on getting maximum nutrition from fewer calories — making high-protein, lean foods like chicken even more attractive. It also highlights the 2025-2030 Dietary Guidelines for Americans, which boosted recommended protein intake by as much as 100% over prior editions, and notes that 83% of US consumers now report reading food labels before purchasing. Meanwhile, prolonged food inflation has made shoppers more value-conscious, further elevating chicken’s reputation as an affordable, high-quality protein.
WHAT’S NEXT: The Rabobank report suggests that nutrient density is “just getting started” as a framework shaping how consumers, retailers, and manufacturers evaluate food. The report predicts that label-scanning apps, evolving dietary guidelines, and continued GLP-1 adoption will further amplify consumer focus on protein content per calorie and per dollar.